


This page contains blog posts and articles, in chronological order, relating to urban design + transport
Category Archives: Transport+Urban Design
Cycling Transport Transport+Urban Design Urban Design Will
Great Planning Advice for UK Local Authorities
2013, November 29 – 15:39
OK call me uncool for enthusing about yet another policy document but it’s nothing short of wonderful to see responsible parties finally joining the dots between poor, car-dependent planning and our obesity crisis!
This is the UK’s Department of Health, through a subsidiary office, Public Health England, working with the organisation that co-ordinates local governments throughout England and Wales, to promote more sensible planning after decades of obesogenic developments. May it grow big teeth and play its part in our progress towards healthier towns and cities.
Good to see a health-policy briefing listing off our favourite advantages of increased cycling and walking-
• supports local businesses and promotes vibrant town centres
• provides a high-quality, appealing public realm
• reduces car travel, air pollution, carbon dioxide emissions and congestion
• reduces road danger and noise • increases the number of people of all ages out on the streets, making public spaces seem more welcoming and providing opportunities for social interaction and children’s play
• provides an opportunity for everyone, including people with impairments, to exerience and enjoy the outdoor environment
“…smart people are working to change all this…”
2013, November 12 – 16:20
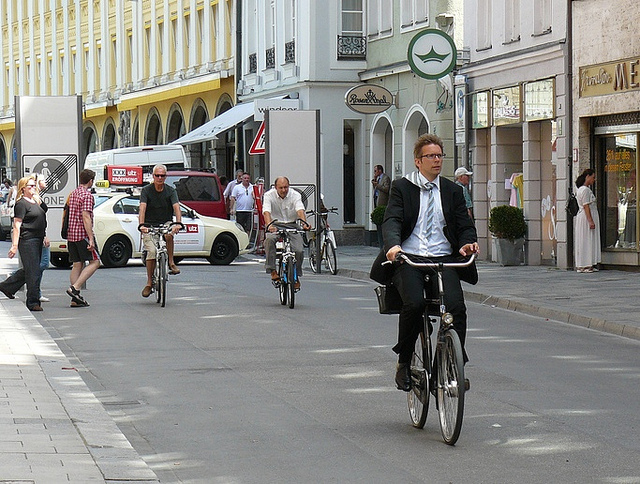
More on the failure to enforce laws in cyclist injury collisions
A thoughtful & well researched article in the New York Times by Daniel Duane, who’s a contributing editor to Men’s Journal-
http://www.nytimes.com/2013/11/10/opinion/sunday/is-it-ok-to-kill-cyclists.html
Fat Kids + Urban Design -The Link!
2013, July 5 – 15:14
Professor John Ashton, appointed President of the UK’s Faculty of Public Health in July 2013, has suggested children need to walk at least quarter of a mile each day to school keep fit and prevent obesity.
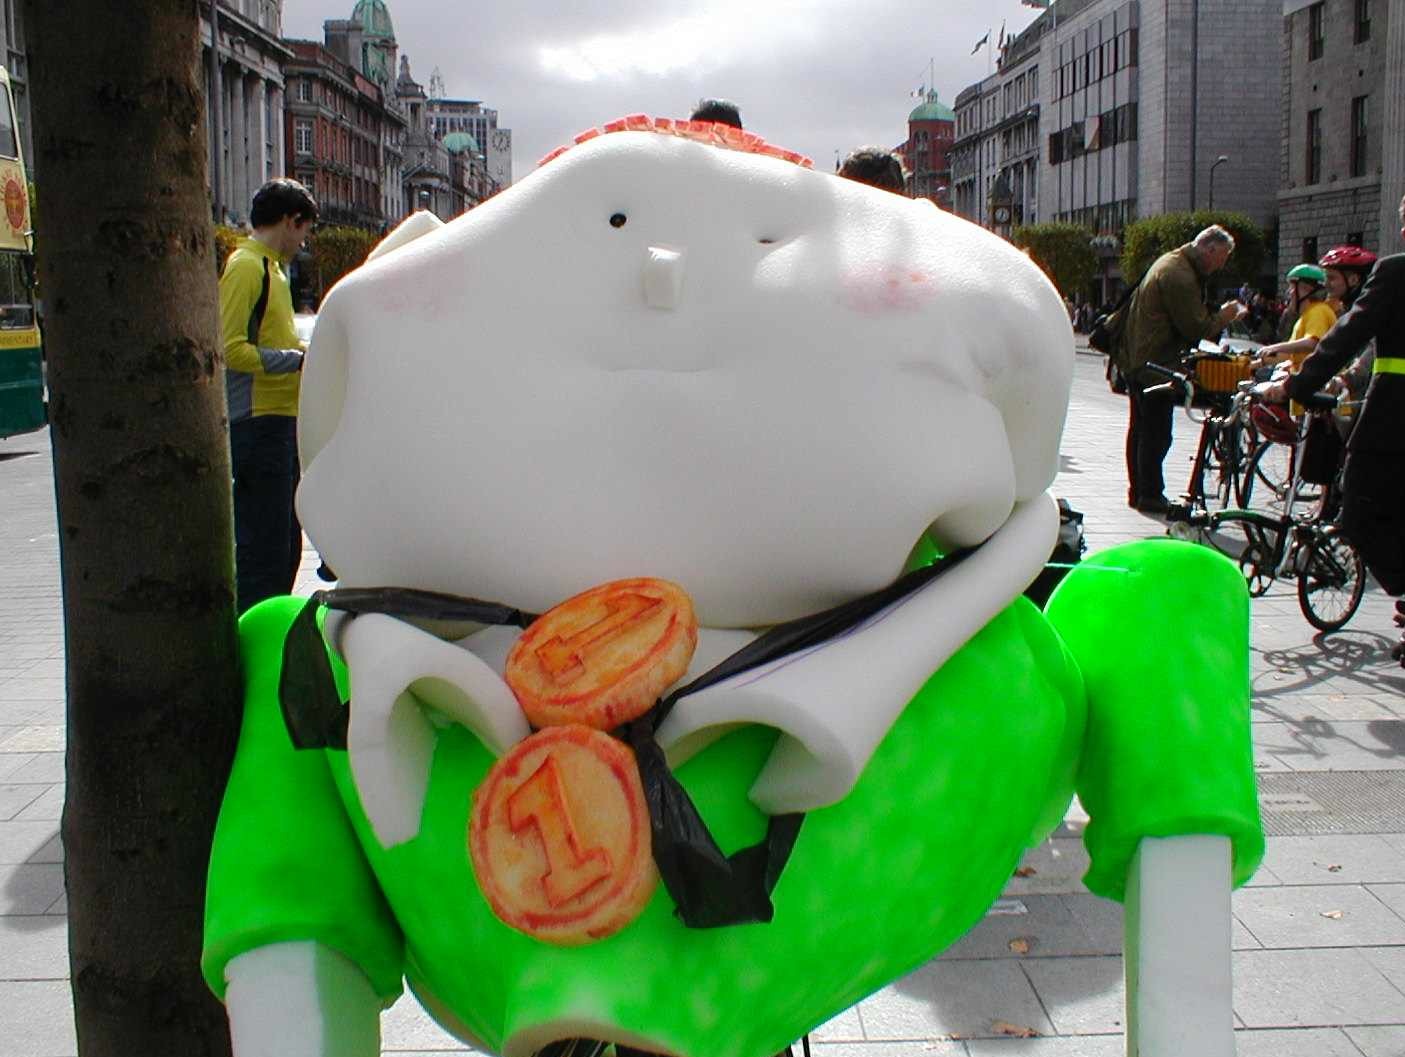
UK National Health Service statistics have shown that between 2000 and 2009 in England and Wale, the number of 5 to 19 year olds admitted to hospital with obesity related issues have increased from 872 to 3,806.
The Telegraph newspaper quotes Prof. Ashton as saying, “public health efforts must focus on town planning as much as on general health” and proposing drop-off points a ‘quarter-mile’ from school gates.
“One of the things we should be doing is really strictly prohibiting cars stopping outside school to drop kids off but having drop-off points, if at all, a few hundred yards away so at least the children get to walk a quarter of a mile each day from the dropping-off point … it would make a difference,” he told the newspaper
The San Francisco Bicycle Coalition
2013, July 3 – 17:31
Personal impressions from San Francisco for Dublin Cycling Campaign Committee.
Dublin and San Francisco are similarly-sized cities with equally low modal share. However the San Francisco Bicycle SFBC has 12,000 members and a full-time staff of 15, while Dublin Cycling Campaign has about 500 currently paid-up members, and less than one paid staff member. I visited the SFBC to try to learn a bit more.

Why the SFBC? Our larger colleagues in VOCA, CTC and ECF are giving us plenty of precedents and comparison on their organisation and growth -Burkhard Horn’s recent talk is exemplary. However I’ve personal experience of cycling in SF, the cities’ size, density and culture are comparable, and the growth and dynamism of the San Francisco Bicycle SFBC are certainly noteworthy. So I hope there’s someting of interest to the Campaign here. I’ve appended some notes on cycling in SF.
San Francisco Bicycle Coalition (SFBC). Established 1971. See sfbike.org/?about
- Structure:
- 15 Board Members (elected by members) set policy, ensure financial sustainability. Bi-monthly meetings.
- Full Member meetings twice yearly but attendance often less than 200
- 15 full-time staff including Governance, Admin, Graphic Design, Fundraising and PRO –these entirely separate & distinct from Board
- Priority is set by 5-year Action Plan, based on Membership meetings and setting goals for City e.g. ’Encourage increasede biking among San Franciscans under 18 with 5% biking frequently…’ Current Overall Goal of Strategy is, ‘By 2017, at least half of San Franciscans will bicycle occasionally, and at least one quarter will bicycle frequently or at least a few times per week’.
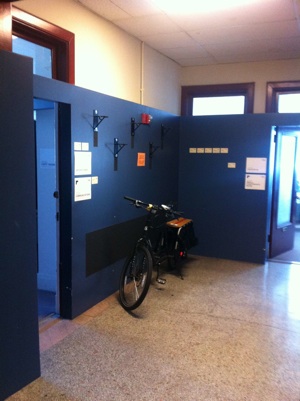
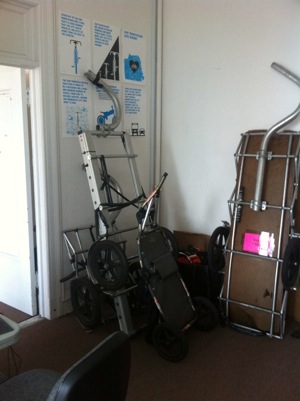
- Permanent office on 10th floor of downtown building. Big kitchen, noticeboards, plenty of open-plan office space workspace for layout, computer room with several terminals (also contains storage for loaner trailers!) See photos.
- The SFBC is active in many fields, most parallel to the Campaign’s work-
- Infrastructure planning –the SFBC independently produced a plan for a network of bike-friendly routes (preference was to separate from motor traffic) called ‘Connecting the City’
- Official/political and public advocacy, often using volunteers to contact politicians, demonstrate etc.
- training for adults, families and kids including publication of how-to guides. Contracts with City to provide school-based training, training for taxi and bus/tram drivers, valet parking at sports games, running bike to work day etc.
- Emphasis on building separated bike lanes rather than taming motor vehicle use is different from the Campaign’s but SFBC arrived at this policy by consultation with both existing cyclists and non-cyclists.
Jodie Madeiros, the SFBC’s Development Director, kindly gave me almost two hours of her time and a tour of the SFBC’s offices on the 7th June. Jodie deals with larger donors, developing networks of donors/sponsors, and fundraising events. She joined the SFBC in 2005; she was the fourth professional staff member.
I asked Jodie about the SFBC’s growth, particularly in the early 2000’s when they underwent rapid membership expansion. She said that the critical item was membership. ‘Gain; engage; retain’ was the mantra. This was a top priority- one of the first staff members to be employed was responsible for membership systems (database, renewals, membership benefits like bike shop discounts etc.).
The SFBC’s Annual Report for 2001 is available online. That year, membership was 3,200, providing income of $104,326 out of a total income of about $300,000. This total supported four full-time and two part-time staff. There were four donations in the $10,000-and-above bracket. About ten bike businesses made donations of between $1,000 and $2,500. This might represent a medium-term goal for the Campaign.The SFBC’s 2004 Annual Report shows 4,500 members, and income of $452,000.
Membership-
As part of gaining new members, the SFBC does outreach programmes regularly. These often consist of on-street public appearances where volunteers or staff engage cyclists and canvass for support –accompanied by the handing out of free items like coffee, bike services, or granola bars, and will be supported by sponsor businesses. New members are offered discounts at over 60 bike businesses, free bike trailer/bike box rental, free entry to recreational rides and parties, a bike map, guide book, and quarterly newsletter.
Members are engaged by the weekly newsletter, by yearly meetings/election of Board members, by volunteer evenings (see below), by being asked to sign petitions, send postcards or demonstrate at City Hall for specific causes, e.g. bike lanes on particular streets. Similar causes are supported by pre-written postcards to City officials which are enclosed in the seasonal newsletter ‘Tube Times’ for completion by members; delivery of the newsletter is by volunteer. Survey rides –checking local bikeability and collating reports for officialdom- are also done by volunteers.
The SFBC retains members by managing renewals professionally, by keeping them well informed, and by putting much effort into getting them involved in campaigning or helping. Jodie reckons that if still members after three years, members are much more likely to become ‘sticky’ i.e. keep renewing for the long term.
Volunteer evenings- These are held twice a month on a Wednesday evening. On June 12th when I attended, volunteers were put to work personalising renewal notices for members, i.e. handwriting a ‘please renew’ message on printed renewal letters. We then collated and envelope-stuffed a batch of ‘thank-you’ letters to financial donors, and finished up with hand-making collaged cards thanking the SF transport authority for creating new bike lanes on Market Street (I’d arrived at the SFBC office using these lanes).In addition, volunteers were asked during the evening to appear and testify at an upcoming hearing into new roads infrastructure, and to attend a course in what a Bike Share scheme is (one is proposed for SF) and how to promote one. A take-away Thai dinner ended a pleasant, very sociable couple of hours.
Finances-
SFBC Income breakdown. Total income for 2011 was $1.5 million. Personnel costs account for 74%
| Membership subscriptions | 24% | Individual $35; other family member $15 etc. |
| Individual Contributions | 20% | Vary from $250 to $25,000 |
| Events, fundraisers and Benefits | 19% | Bike ride with Gary Fisher $50; Golden Wheel gala $75 etc. |
| Contracts (often with City) | 16% | For bike training, hosting bike-to-work day etc. |
| Foundation Grants | 11% | Also $250 to $25,000+, from bike companies, legal firms etc. |
| Business partner supports | 6% | In-kind supports eg refreshments at events, bike parts, prizes… |
| Program service fees | 4% | ?? possibly this is payment for training services etc? |
| 100% |
For fundraising, as can be seen in the table, donations, fundraising and benefit events such as sponsored rides are important contributors. Jodie described how the SFBC use their social and business networks e.g. Board members’ contacts to encourage potential donors, hosting network ‘Luncheons’ for example. An existing sponsor will host lunch and the SFBC will make a presentation, asking the sponsor to follow up with communications to the guests. This might focus on sponsorship for a specific event etc.
The City contracts the SFBC on a paid basis in several ways – Helping with bike to work day by providing volunteers to help man free-breakfast or coffee stations Manning bike services stations and training stations at Open Streets days (a regular occurrence in SF where a street (can be over a mile in length) will be opened to non-motorised traffic including stalls, performance, games etc. and the SFBCs provide training for adults & kids as part of the festivities. (This is in addition to the weekly Cyclo Via in Golden Gate Park).Running Safe Routes to School with other organisations. Training for peds & Cyclists in schools.Training for taxi drivers and MUNI (bus and tram) drivers.The SFBC’s weekly newsletter (email only) has a 24,000-strong list, and a high 30% open rate. This database includes political groups, transport groups etc. as well as members.
Summary notes-
Organisation-
SFBC’s five-year plan sets out its goals for city-wide cycling numbers, infrastructure roll-out etc., not just for internal Campaign accomplishments. More ambitious than Campaign’s plans.Like the Campaign, the SFBC’s various departments each have a related five-year plan.The separated Board and Staff structure is different from Campaign’s integrated structure –not relevant at Campaign’s current size, but arguably logical to separate policy from administration.
Membership-
Offering concrete benefits could include retail discounts as we’re already planning, small handouts (donated by sponsors) like ‘spoke cards’ with cycling tips, lights; maps and guides (‘insider information’); cargo-bike loans; the weekly e-newsletter and quarterly magazineParticipation might be encouraged by using pre-printed postcards to enable lobbying on particular issues; volunteer evenings or similar, as well as social rides.The (rare and quite particular) culture of dissent and progressiveness of San Francisco assists organisations like the SFBC; Dublin civic culture may well be more conservative and by comparison.
Financing-
Professional advice on fundraising might be advisable –perhaps from Wheel or other voluntary source.The SFBC is –and I think was in the early 2000s- more business-like and hard-nosed than the Campaign. Earning money for any productive work done is set as a priority.My impression is that the culture of bequests and donations –and the wealthy segment of population- is much smaller in Ireland. But the Campaign might look at earning some funding from running public/cyclist-oriented events.Another source of funding is the cycling industry, e.g. the SFBC’s ‘valet parking’ service at major events was exclusively funded by a manufacturer. The Campaign is already tapping this via the ECF and An Taisce.The SFBC’s example of contracting to give training and promotion for the City would also merit further study (Production of videos and individuals’ provision of training might be brought ‘in-house’ and administered by the Campaign).It seems the key to initial growth –from volunteer to professional status- is a skilled and dedicated staff member working on retaining, engaging and growing our membership numbers and engagement.
2013- July
Cycling in San Francisco, United States compared to Dublin
2013, July 3 – 16:58
How is it to cycle in San Francisco? Are the size and resources of the SFBC reflected in an ordinary cyclist’s experience on the ground!?
These are subjective impressions. My experience of cycling in SF includes working as a courier in the downtown area over 20 years ago, brief cycling visits since, and anecdotes from many cycling friends. read more
Striking ‘Peak Car’ Study
2013, April 29 – 21:36
This courtesy of Atlantic Cities-
Doug Short, who charts financial data in the US, has put together a nice graph that uses the latest US Transportation Department data on vehicle-miles driven and adjusts for population growth.
Post columnist Brad Plumer writes that surveys have concluded young people “prefer to live places where they can easily walk, bike, and take public transportation.” Also that with higher petrol prices, more stringent driver-license systems, communication being carried out more & more online, and younger people preferring to live in denser, more diverse neighbourhoods, the decline of car use -and corresponding increases in public and non-motorised transport- is set to continue.

Looked at this way, the plunge in driving is quite startling, and began back in June 2005.
Congestion the bitter harvest of poor urban planning
2013, April 29 – 16:47
An extraordinary reaction to the ‘Funding Auckland’s Transport Future’ report, published in April 2013 shows the cluelessness of policy-makers.
Auckland’s ‘Consensus Building Group’ today published a report setting out two options for raising the twelve billion dollars allegedly required for future transport funding there. Two options are set out-
- Higher rates, fuel taxes and a regional fuel tax
- Road pricing (like London’s congestion charge)
Remarkably, presiding National Party transport minister Gerry Brownlee immediately insisted in a statement that congestion caused by excess car use and under-controlled urban sprawl is not to be questioned or challenged.
According to Radio NZ, ‘Transport Minister Gerry Brownlee, who hasn’t read the report, said a regional fuel tax, congestion charges and road tolls as they stand would never be agreed to. Mr Brownlee said New Zealanders ‘won’t be paying twice for roads’ when money has been generated through their excise duty or road user charges, while a congestion charge would not be appropriate on government-owned roads.’ Have motorists even paid once for these roads? Or does he expect the rest of us to support motorists’ expensive habits?
Fairfax Media reports, ‘A group of Auckland’s business and community leaders, convened by mayor Len Brown to give its view on funding projects to solve the city’s transport crisis, is today calling for public feedback on two funding options. Group chairman Stewart Milne says Auckland faces a $12 billion transport funding shortfall by 2041 if nothing is done. Employers and Manufacturers Association chief executive Kim Campbell says the city will suffer if nothing happens: “Finally when the place comes to a grinding halt, that’s when people leave. We don’t think that’s a responsible view.”
“Our population is projected to grow by as much as 1 million, with around 60 per cent of that coming from our existing populace”, says Brown.
The public is being asked to submit feedback on the group’s proposals before it makes its recommendations to Auckland Council in July.’ (Scott Morgan, Stuff.co.nz, 2013- April 29th)
This the same day that John Key was wheeled out for a conference of petroleum industry representatives in Auckland to tout oil exploration by ‘large oil companies’ in off-shore claim areas. Hmmmm…
I’m not up to date with the issues but it certainly seems remarkable that funding challenges of up to $12 billion can be discussed by senior Government members without reference to the Unitary Plan, denser urban planning, and the concepts of reducing transport needs from unnecessary car trips.
And looking beyond this current spat, it looks like some of the problems arising from virulent car-dependent sprawl are coming home to roost.
The Seven Wonders of Stoke -and Ranui Road’s NASA star
2013, April 19 – 15:34
I love living in Stoke, New Zealand but sometimes feel it is under-appreciated in the wider Nelson, not to say global, community.
So, to raise us up among suburbs worldwide, here is my Stunning Stoke Postcard, and a list with the first seven of the many, many Wonders of Stoke.

- Stoke Brewery
- Trees in Isel Park
- Our Poorman Stream was found in summer 2013 to have 16 species of fish in a 100-metre stretch!
- Barnicoat walkway and its stunning views to Farewell Spit
- The Hand of Stoke sculpture at the amazing Warren Wiggins-designed Library
- Beautiful new Athletic Pavilion at Saxton Field by Arthouse Architects (image below)
- Proper Crisps Factory. Crisps, beer and -at Pic’s- high-quality peanut butter. All the crucial food groups!
 Hand of Stoke
And that list of Wonders doesn’t include our very own astronomer- Albert Jones, only coming to our attention in September 2013 just after he has gone before us into the stars. Rest in peace, Albert, we are heartened for your gifts to Stoke.
Some words about Albert from the blog, Simostronomy-” This quiet, unassuming New Zealander has made over 500,000 variable star measurements over the last 60 years or so. He has received honors from the Royal Society of New Zealand, the American Association of Variable Star Observers, the Smithsonian Astrophysical Observatory, the Astronomical Society of the Pacific, the British Astronomical Association, the Royal Astronomical Society, and has received an Honorary Doctorate of Science from Victoria University in Wellington, New Zealand.
In 1964 he was made one of the first four Fellows of the Royal Astronomical Society of New Zealand, and in 1987 he was awarded an Order of the British Empire (OBE) for his services to astronomy. Minor planet 3152 was named after him in 1988 in recognition of his achievements
Albert told Somostronomy, ‘After I left school at the age of 16, I was well aware of my limited knowledge and never dreamed that one day I might be able to make a contribution to Astronomy, but for my own fun, and to satisfy my curiosity, I could at least learn the constellations and be able to recognize planets. So with the aid of books, I did that.
‘Then in answer to a request in the newspaper for reports of aurorae, I made detailed notes of the next aurora that I saw, sent it in and was thrilled with the reply stating it was the best report received. So two years later, I timidly asked if there was an astronomy club or society that might accept me as a member. Soon after, I became a member of the New Zealand Astronomical Society (later to become the Royal Astronomical Society New Zealand; RASNZ). Then I started receiving their journal ‘Southern Stars’”.
I often wondered why there were screens on some street lights outside Albert’s house, a minute’s walk from ours on Ranui Road. Turns out they were screened by Council on request from the US’ NASA- Albert’s work was so valuable to them that they sent a letter backing his request for less light spill onto his observatory!
Truly a wonder of his own.
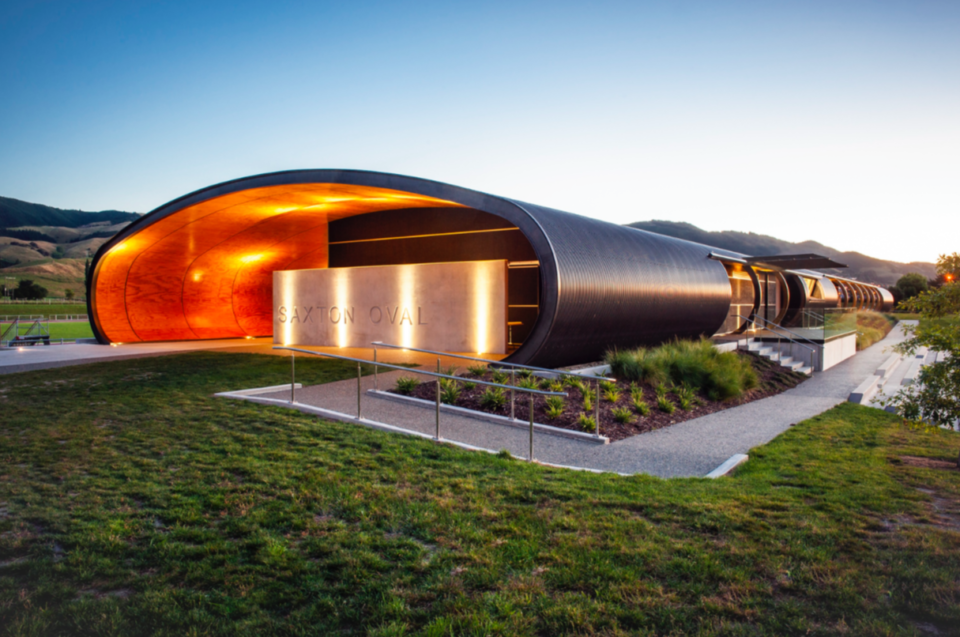 Arthouse Architects’ stunning pavilion at Saxton Field
Cycling the ‘Wonder Drug’
2013, April 6 – 11:52
From European Cycling Federation in a recent news article, a nicely-worded summary-
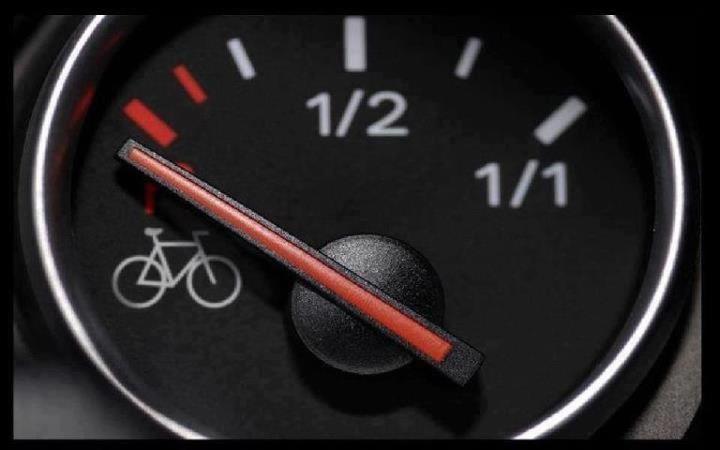
Cycling is the wonder drug of the transport world. It provides solutions to so many problems and unlike most forms of transport, it has lots of positive side effects. Think about it: people riding bicycles makes no noise, emit no air pollutants or greenhouse gases, they ease traffic congestion… the list goes on. But the real bread winner for policy makers are the health benefits. The more people cycle, the healthier they are. This means that cyclists don’t just ease congested streets, but they ease congested health systems. Higher levels of physical activity translates into reduced morbidity (ill health) and reduced mortality of cyclists.
Promote Hi-Viz, but not like this…
2013, April 6 – 09:55
What’s depressing about well-meaning taxpayer-funded initiatives like this is the total lack of understanding of the most simple, basic concepts of risk by those who should know better!
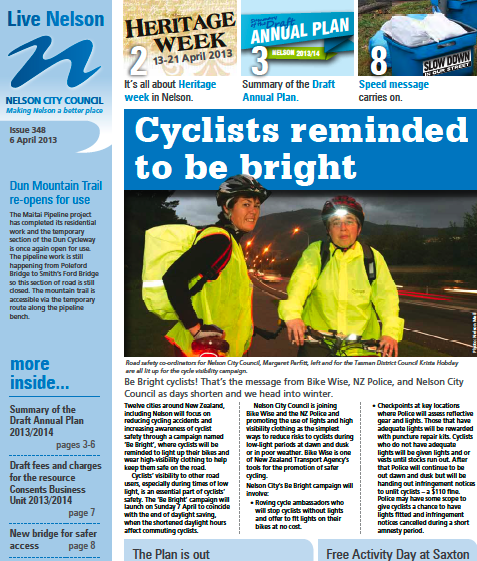
- Yet Another Misguided Hi-Viz Promotion (PDF, 1.8Mb)
In sharing the road with motorists, where is the risk to cyclists being created? From the motor vehicles, of course. So who should we educate and nag? Yes, well done. Those wielding over-powered heavy fast-moving metal objects.
If we’ve got funding for road safety measures, let’s improve driver standards by promotional campaigns, better driver training, lower speed limits, ongoing skills tests, higher enforcement before blaming the victims of poor driving.
For a real road-safety improvement measure, how about random stopping of motorists to test how good they are at spotting cyclists’ lights from a distance!?
 Hello
Hello